Apple Business Connect Insights Report
Table of Contents
Summary
Apple Insights is an analytics feature offered exclusively by Uberall. The report will provide Insights for all your locations, visualizations to help you gain a deeper understanding of how people find your business, and what they do once they find it. Insights data includes searches, views, and Actions associated with your business listing in Maps. This document covers the entire report breakdown, requirements for proper enablement, and FAQs.
EV Listings and their Insights
Apple currently does NOT support EV Analytics. EV is a protected category and you cannot claim those listings. Since you cannot claim, there are no insights. Apple are considering changing this, but nothing specific has been announced.
The Report
Filters (Controls) - The report can be filtered by Account, Label, City, Zip/Postcode, Location Group, Locations(s), and date range.

Total Views

See the number of Total Views of your location's Place Card from customers tapping your location in search results or on the map, as well as referrals from Apple or third-party apps. The visual will provide Total Views for the selected time period, percentage change compared to the previous period, and the total for the previous period.
Total Interactions

See the total number of times customers completed the following types of actions when viewing your listing. The visual will provide Total Interactions for the selected time period, the percentage change compared to the previous period, and the total for the previous period. More details on the interaction types are provided below.
Total Taps on Location

The Search tab provides modules to see how many times customers found you and how they found you. View the number of Total Taps on your location in search results. The visual will provide Total Taps on Location for the selected time period, the percentage change compared to the previous period, and the total for the previous period. More details on the interaction types are provided below. More details on monthly Total Taps are provided below.
Views
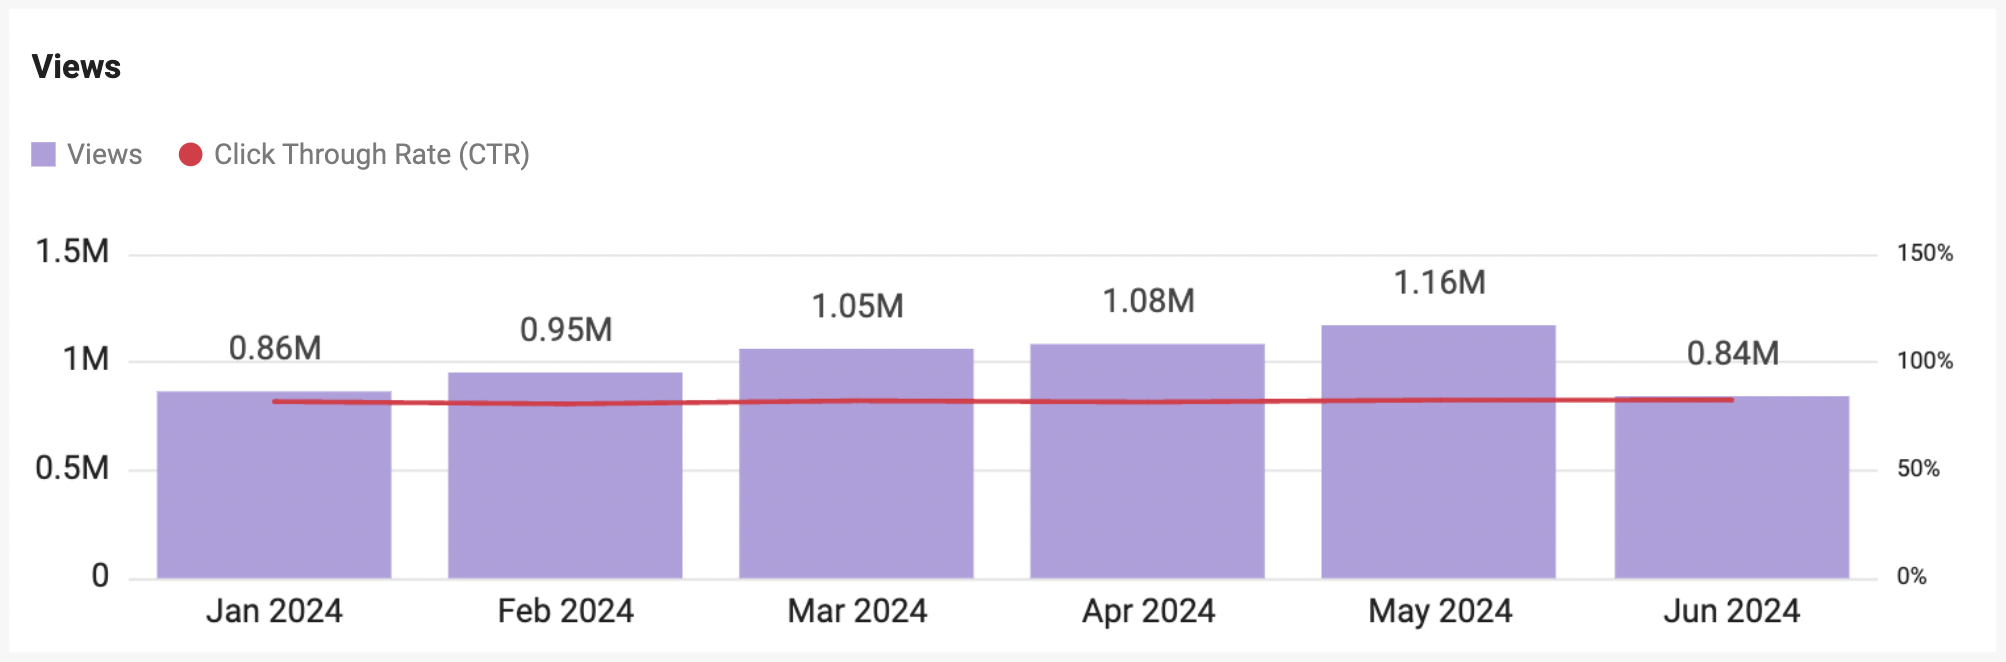
See the number of views of your location's Place Card from customers tapping your location in search results or on the map, as well as referrals from Apple or third-party apps. The visual will provide views aggregated monthly for the selected time period, the percentage change compared to the previous period, and the total for the previous period.
Interactions

See the total number of each interaction customers completed while viewing your listing (select each action type below for more details). The visual will provide interactions for the selected time period. Definitions are outlined below.
Interactions Definitions
| Interaction | Definition |
| Directions | A customer tapped to request directions to your location. |
| Photos | A customer tapped or swiped in the photo gallery. |
| Website | A customer tapped on your website URL. |
| Call | A customer tapped on your phone number. |
| Share | A customer tapped on the Share button. |
| Business Actions | A customer tapped on a business Action (if present). Examples of business Actions include reserve, order, and view menu. |
| Order Food | See how often a customer tapped on your CTA to place an order. |
Note: Apple Showcase data is currently not available through Apple natively or the API.
Important Note for Taps
Not all data available in ABC Natively is available through the API. All the metrics we show in our current ABC report is what Apple enables for us to pull through the API. Some data will not be available through the API. Tap specific's like the following:
- Placecard Order Takeout
- Placecard Pickup
- Placecard View Menu
- Placecard Schedule Appointment
- Placecard View Availability
- Placecard View Pricing
are already pipelined in however, Apple exposes 0 data through it. Apple did not confirm if/when they will. Therefore, all the current Taps available in the report are what Apple supports.
- Directions
- Photos
- Call
- Share
- Website
- Food Order
Mapping of Apple Listings Business Actions
| Apple Listings Actions | Description |
| Driving Directions | Number of taps on the Directions button on your location’s place card |
| Buy Tickets | Number of taps on the Buy Tickets button on your location’s place card |
| Share | Number of taps on the Share button on your location’s place card |
| Parking | Number of taps on the Parking button on your location’s place card |
| Reserve Table | Number of taps on the Table button on your location’s place card |
| Waitlist | Number of taps on the Waitlist button on your location’s place card |
| Menu | Number of taps on the View Menu button on your location’s place card |
| Book Appointment | Number of taps on the Schedule Appointment button on your location’s place card |
| View Availability | Number of taps on the View Availability button on your location’s place card |
| Pricing | Number of taps on the Pricing button on your location’s place card |
| Photo Gallery Engagement | Number of taps or swipes on photos on your location’s place card |
| Website | Number of taps on the Website button on your location’s place card |
| Tap to Call | Number of taps on the Call button on your location’s place card |
| Order Now | Number of taps on the Delivery, Food, Takeout, Pickup, or Order button on your location’s place card |
Total Taps on Location
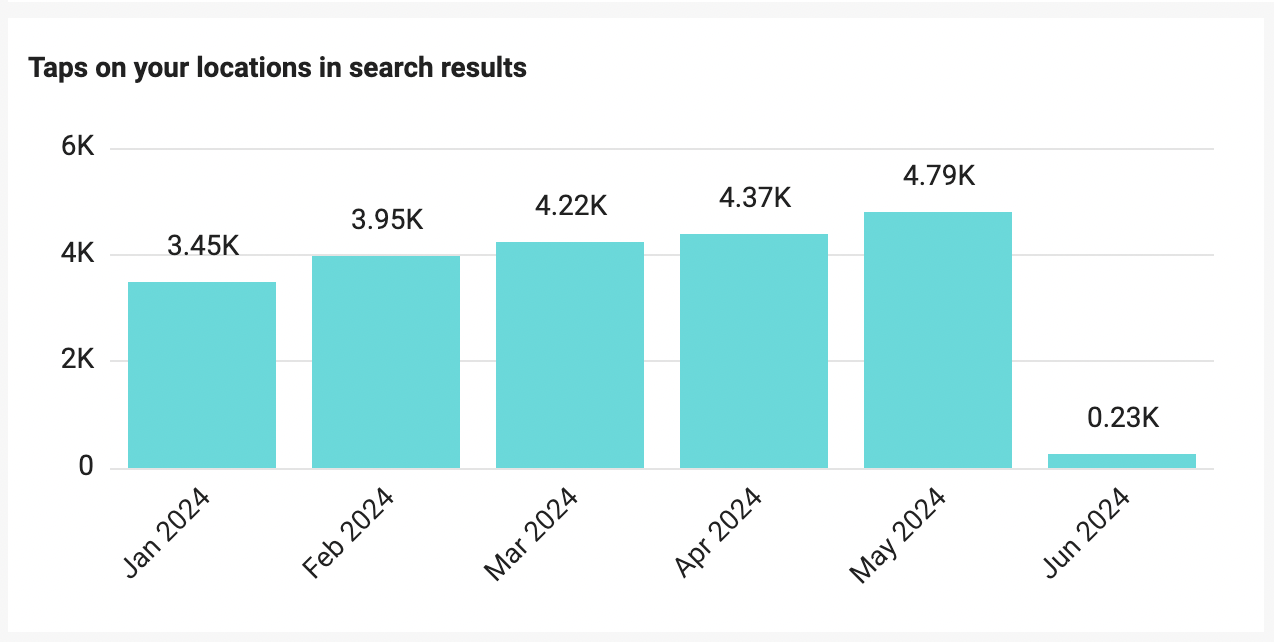
The Search tab provides modules to see how many times customers found you and how they found you. View the number of Taps on your location in search results aggregated monthly. The visual will provide Taps on Location for the selected time period.
How Customers Found You
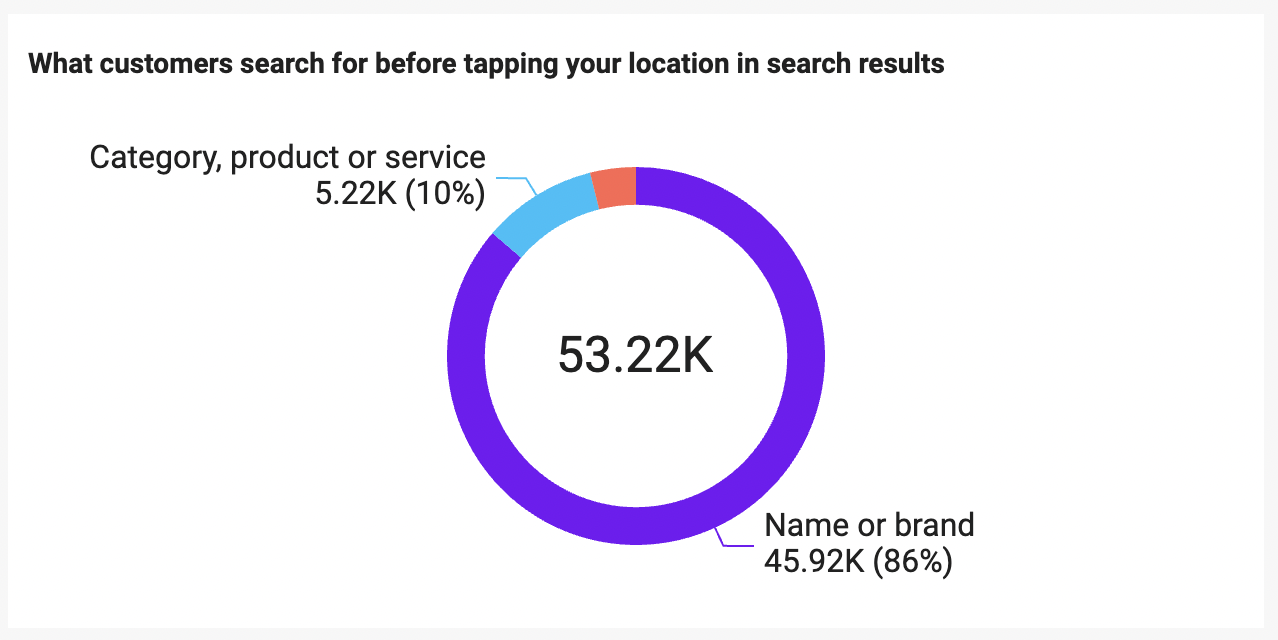
See what customers searched for before tapping your location.
| Name or brand search | A customer searched directly for a business name or brand related to your location. |
| Category search | A customer searched for a product, service, or business category related to your location. |
| Other | A customer searched for places like cities or addresses as well as unclassifiable searches. |
| Unspecified | In cases when the Search Tap Type is not provided by Apple for the purpose of identity protection, Search Taps will be aggregated under this dimension. |
Location Table
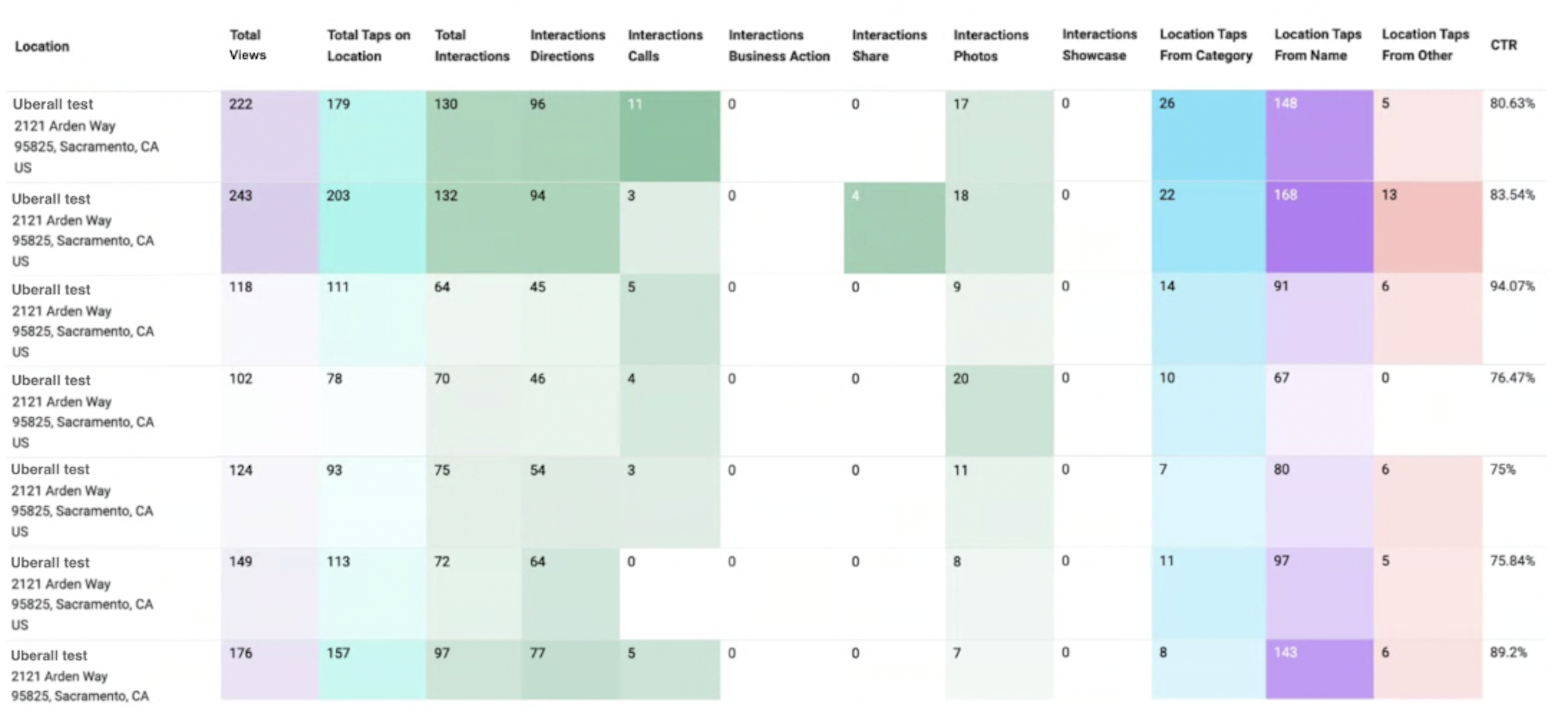
The Location Table will display all the metrics outlined above for each location. Each cell will include a gradient color shadow to represent the high, mid, and low ranges of each metric, compared across all your locations.
Requirements for Enablement
Requirements for Enablement
- Linking your Apple Business Connect account with Uberall is required to pull metrics into Uberall. For more information, see Apple Business Connect (ABC).
- The entity must be Synced on Apple. For more information, see Apple Business Connect (ABC) for more Details.
- The entity must have a Uberall Listings subscription.
Limitations
- Data Availability: Uberall can retrieve up to the most recent 13 months of data.
- Threshold Restrictions: In some cases, metrics below a certain threshold may not be available due to Apple’s restrictions. These unmapped metrics will be grouped into a single 'Unspecified' dimension.
- Apple Showcase Posting: Metrics for Apple Showcase Posting are not yet available but will be coming soon.
- Data Lag: There is a 4-5 day data lag period for key completed dates.
FAQ
When will Showcase data be available?
Apple has not specified when will this data be available through their API. We are in frequent communications with Apple and will make updates to the Apple Insights as soon as this data is available.
When will the Heatmap be available?
Apple has not specified when all required data for the Heatmap will be available through the API. We are in frequent communications with Apple and will make updates to the Apple Insights as soon as this data is available.
How does Apple determine the “Location Like Yours” data?
In Apple Insights, the "Locations Like Yours" feature typically refers to a comparison metric that shows how your location’s metrics (like foot traffic or engagement) stack up against similar locations. These similar locations are usually defined based on characteristics such as:
- Industry: Other businesses or venues in the same sector.
- Geographical area: Locations within the same region or area.
- Demographics: Locations that attract similar customer demographics.
Apple uses aggregated data and advanced analytics to group locations with comparable profiles. This helps businesses understand their performance in context and benchmark against peers. Apple does not disclose the specific criteria or data points used to define these comparisons, such as the exact characteristics considered (industry, geographical area, demographics, etc.). For detailed information, you might need to refer to Apple's support or keep watch for any updates on Apple's website/documentation.
When will competitor data be available?
Apple has not specified when will this data be available through their API. We are in frequent communications with Apple and will make updates to the Apple Insights as soon as this data is available.