Summary
Purpose
The Sentiment Analysis dashboard offers valuable insights into customer feedback across your locations, enabling you to quickly identify whether a topic is trending positively or negatively, so you can prioritize areas for improvement.
Target Audience
You will be interested in the Sentiment Analysis dashboard if you manage multiple business locations and/or large volumes of review, and you are looking for actionable insights from customer feedback.
When is the data refreshed?
When enabled, the Sentiment Analysis data will take up to 24 hours for data to be available. Once enabled, the dashboard is continuously updated every 15 minutes to bring in more recent reviews.
Visual Walkthrough
Navigation
The Sentiment Analysis dashboard is in Uberall's Analytics module.
- Start by clicking on Analytics on the side navigation bar
- When enabled, Sentiment Analysis will appear in the sub-list
Filters
At the top-right of the Sentiment Analysis dashboard are the following filters that you can utilize to adjust the data in the dashboard.
- Business
- Groups
- Locations
- Directories
- Date (defaults to last 30 days)
Sentiment Dashboard Cards

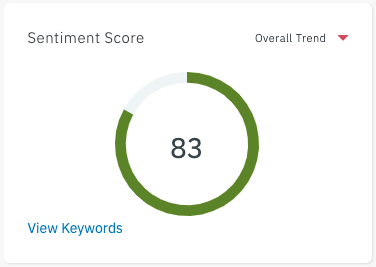
Sentiment Score
The Sentiment score is a starting point to see how customers generally feel about your locations. This is on a scale of 0-100 and provides a summary of the overall sentiment of all reviews from the filtered locations. An easy way to think of the score is:
- 0 - all negative reviews
- 50 - all neutral (or an even number of negative and positive reviews)
- 100 - all positive reviews
Scoring Formula
Uberall assigns each sentiment value a number of points:
- Negative Sentiment is scored as 0 points
- Neutral Sentiment is scored as 1 point
- Positive Sentiment is scored as 2 points
The highest possible grade is 100%, based on the sentiment of each review and the total number of reviews received. The formula for calculating the grade is:
Grade = Total Points Scored / Maximum Possible Points
Let’s take a look at some examples to see how this would work.
Example 1
A location has three reviews that have been labeled with the following mentions of “Food”:

- Review 1 = Positive (2 points)
- Review 2 = Neutral (1 point)
- Review 3 = Negative (0 points)
Total Points Earned = 3 points
Each review has the potential to earn 2 points (positive sentiment). This means that the maximum possible score for this example under the Food theme would be 6 points.
Based on the total points earned for the three reviews, the “Food” grade for this location would be:
3 (total points earned) / 6 (Maximum Possible Points) = .50 or 50%.
Example 2
Let’s look at another example that is calculating a summary sentiment grade across multiple locations.
Let’s assume that you have 100 locations and, across those 100 locations, you’ve received 1,000 reviews of varying sentiment. In this case, the Maximum Possible Points would be 2,000 (1,000 reviews x 2 points possible per review).
Let’s assume that the actual positive/neutral/negative points scored across those 1,000 reviews = 1,652. In this case, the summary sentiment for this group of locations would be:
1,652 / 2,000 = .826 or 83%.
Keyword Cloud
By clicking on View Keywords under the score, you'll see a keyword cloud containing the most frequently used words in your reviews, as well as a color corresponding to the sentiment of those reviews.
- Green indicates positive sentiment
- Yellow indicates neutral sentiment
- Red indicates negative sentiment

Total Mentions
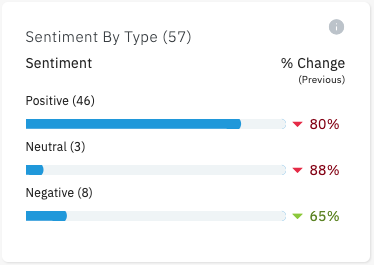
The total mentions will help you keep track of your positive, neutral and negative review count and trends.
Trending up & Trending Down
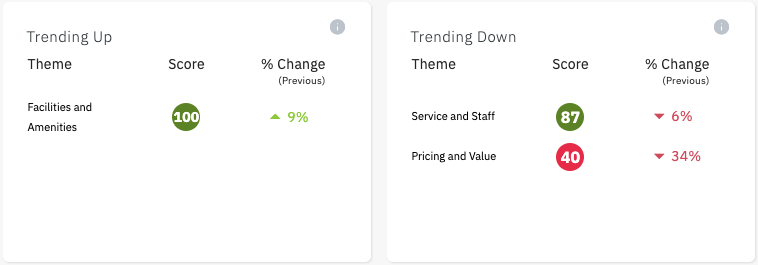
These sections will categorize the sentiment themes extracted from your reviews. Each category will receive its own score and trending indicator
Sentiment Location Table
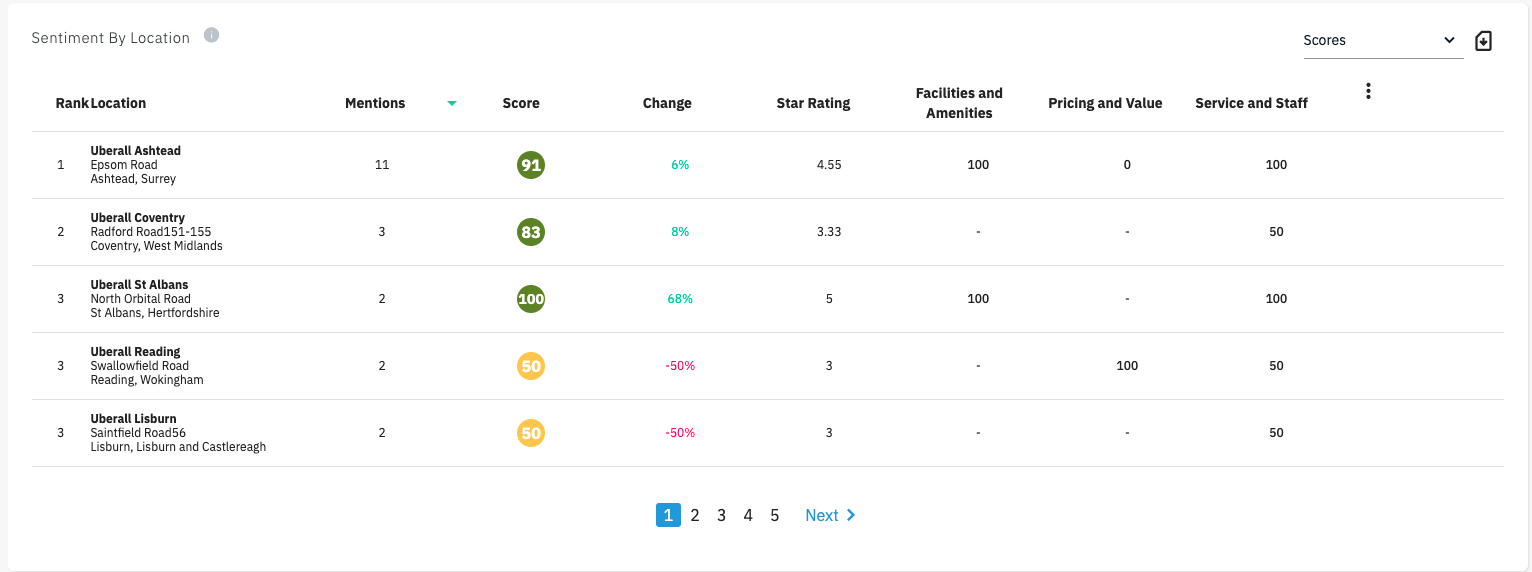
Further down in the Sentiment Analysis Dashboard, we will see the sentiment information outlined for each location. The locations can be filtered using the page filters at the top of the dashboard.
Score filtering
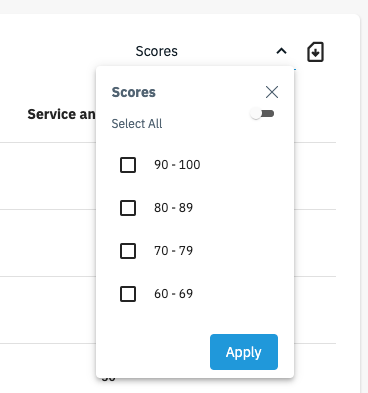
Using the dropdown on the table, you can quickly segment locations by their score thresholds. This will display the locations for the selected score range. Quickly find locations with negative sentiment and work to remedy the customer experience.
Column Visibility
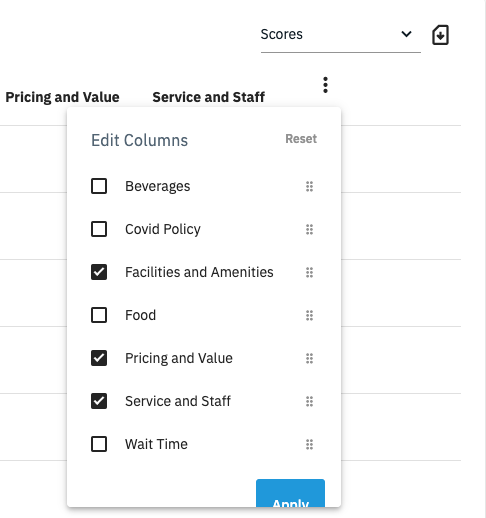
The visible themes in the table can be adjusted by clicking on the columns options button. Add relevant themes or remove non-relevant themes to tailor the experience. Additionally, you can drag-and-drop to reorder the themes in the table to see the most relevant information first.
Location Details
Each row of data includes the following info for each location:
- Ranking of the location based on the sorting criteria of the table
- Number of reviews received
- Overall sentiment score for the location
- Trending indicator
- Average star rating for the location
- Each theme and the sentiment score graded. (note if no reviews were found for the given theme, this will be blank)

Review Panel
Clicking on the score in the sentiment column will reveal a panel that displays all reviews that contribute to that score.
Filter Options
Reviews in the panel can be filtered by theme or sentiment (positive, neutral, negative).
Review Cards
Each review in the review panel will display the following info:
- Directory of origin
- Star rating of the review
- Review content
- Overall sentiment of the review
- Review author
- Listing that the review appears on
FAQS
What languages are currently supported?
Sentiment Analysis can be performed on reviews in all languages that the Uberall platform supports. The report framework is in English.
As for the reviews, they will appear in the original language they were submitted in. For example, if a review was written in Portuguese, it will be displayed in Portuguese in the report, but the sentiment analysis results will be shown in English.
Why aren't all my reviews appearing in the report?
The report performs Sentiment Analysis for reviews with text including:
- Reviews written in all languages supported by the Uberall platform
- All review lengths, no such thing as too long or too short
- Can support reviews with Emoji's
- Can support special fonts (ex: 𝕆𝕦𝕣 𝕊𝕖𝕣𝕧𝕖𝕣 𝕊𝕔𝕠𝕥𝕥𝕚𝕖 𝕨𝕒𝕤 𝔸𝕨𝕖𝕤𝕠𝕞𝕖, 𝕧𝕖𝕣𝕪 𝕡𝕠𝕝𝕚𝕥𝕖)
If the review does not have any text (it is a star-only review), then it will not be included in the sentiment score.
How is sentiment determined?
Reviews can have two different types of sentiment:
Overall Sentiment is an analysis of the overall review text and whether it is positive, neutral or negative. All eligible reviews will at least have an overall sentiment determined
Sentiment Themes are concepts extracted from different parts of the review. Each theme present is then scored for sentiment. For example, a single review may contain a positive note about the food, and a negative note about the service. This would result in the Food and Service themes being identified as positive and negative respectively.
How does the Sentiment Score get calculated?
The sentiment score is an aggregate of all the relevant reviews. Each review or theme will get "points" depending on the sentiment determined:
Positive sentiment - 2 points
Neutral sentiment - 1 point
Negative sentiment - 0 points
The score is a simple ratio of the total points received, divided by the total points that could have been attained. An easy conversion works like this:
0 - all negative
50 - all neutral (or equally negative and positive)
100 - all positive
Does sentiment analyze new reviews only or also older reviews?
All eligible reviews (new and old) will be analyzed for sentiment. Sentiment data will be backfilled for 18 months from when you start using the dashboard.
