Local SEO 2.0
Discover advanced strategies for optimizing your business's online presence, boosting local visibility, and attracting more customers.
Table of Contents
Summary
Local SEO Report 2.0 is our existing Local SEO 1.0 revamped and updated offered by Uberall. This document covers the entire report breakdown, requirements for proper enablement, troubleshooting, and FAQs.
The Report
Languages
The report is available in English, French, Spanish, Italian, and German. Please note that keywords and addresses will appear in the language they were entered into Uberall.
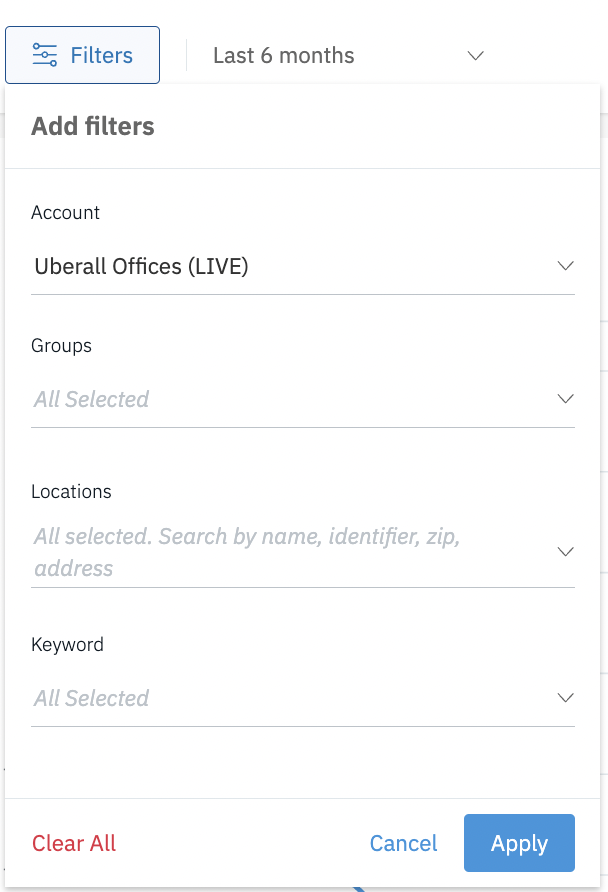
Filters
The report can be filtered by Account, Location Group, Locations(s), Keyword(s), and date range. The report will automatically filter data for the last 6 months.
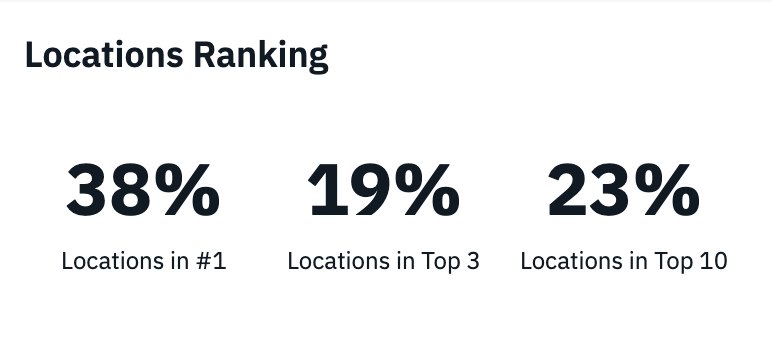
Location Ranking: The "Locations Ranking" section provides a snapshot of how well your locations are performing in search results across key positions:
Locations in #1: This represents the proportion of your locations that have achieved the top spot in search rankings for specific keywords, indicating the highest level of visibility and relevance.
Locations in Top 3: This metric shows how many of your locations are performing exceptionally well by ranking within the top three positions, which are typically the most prominent and receive the most clicks.
Locations in Top 10: This reflects the broader success of your locations by showing how many are appearing on the first page of search results, which is crucial for maintaining visibility and attracting potential customers.
Biggest Movers
- This table highlights the significant changes in search rankings for specific keywords.
-
Keywords and Rankings:
- Gift Cards (30.2): Saw the most significant positive change, moving up 15.6 positions.
- Toppings (6.7): Improved by 15.5 positions.
- Sorbet (8.9): Improved by 11.1 positions.
- Online Ordering (35.3): Improved by 9.1 positions.
- Dairy-Free (9.1): Dropped by 4.1 positions, indicating a negative change in ranking for this term.
- The green upward arrows indicate an improvement in rankings, while the red downward arrow for "Dairy-Free" indicates a drop in rankings.
- Note that change values are a comparative change against the time range you selected in the filters vs the time period before. Ie. This month vs last. This year vs last.

Graph
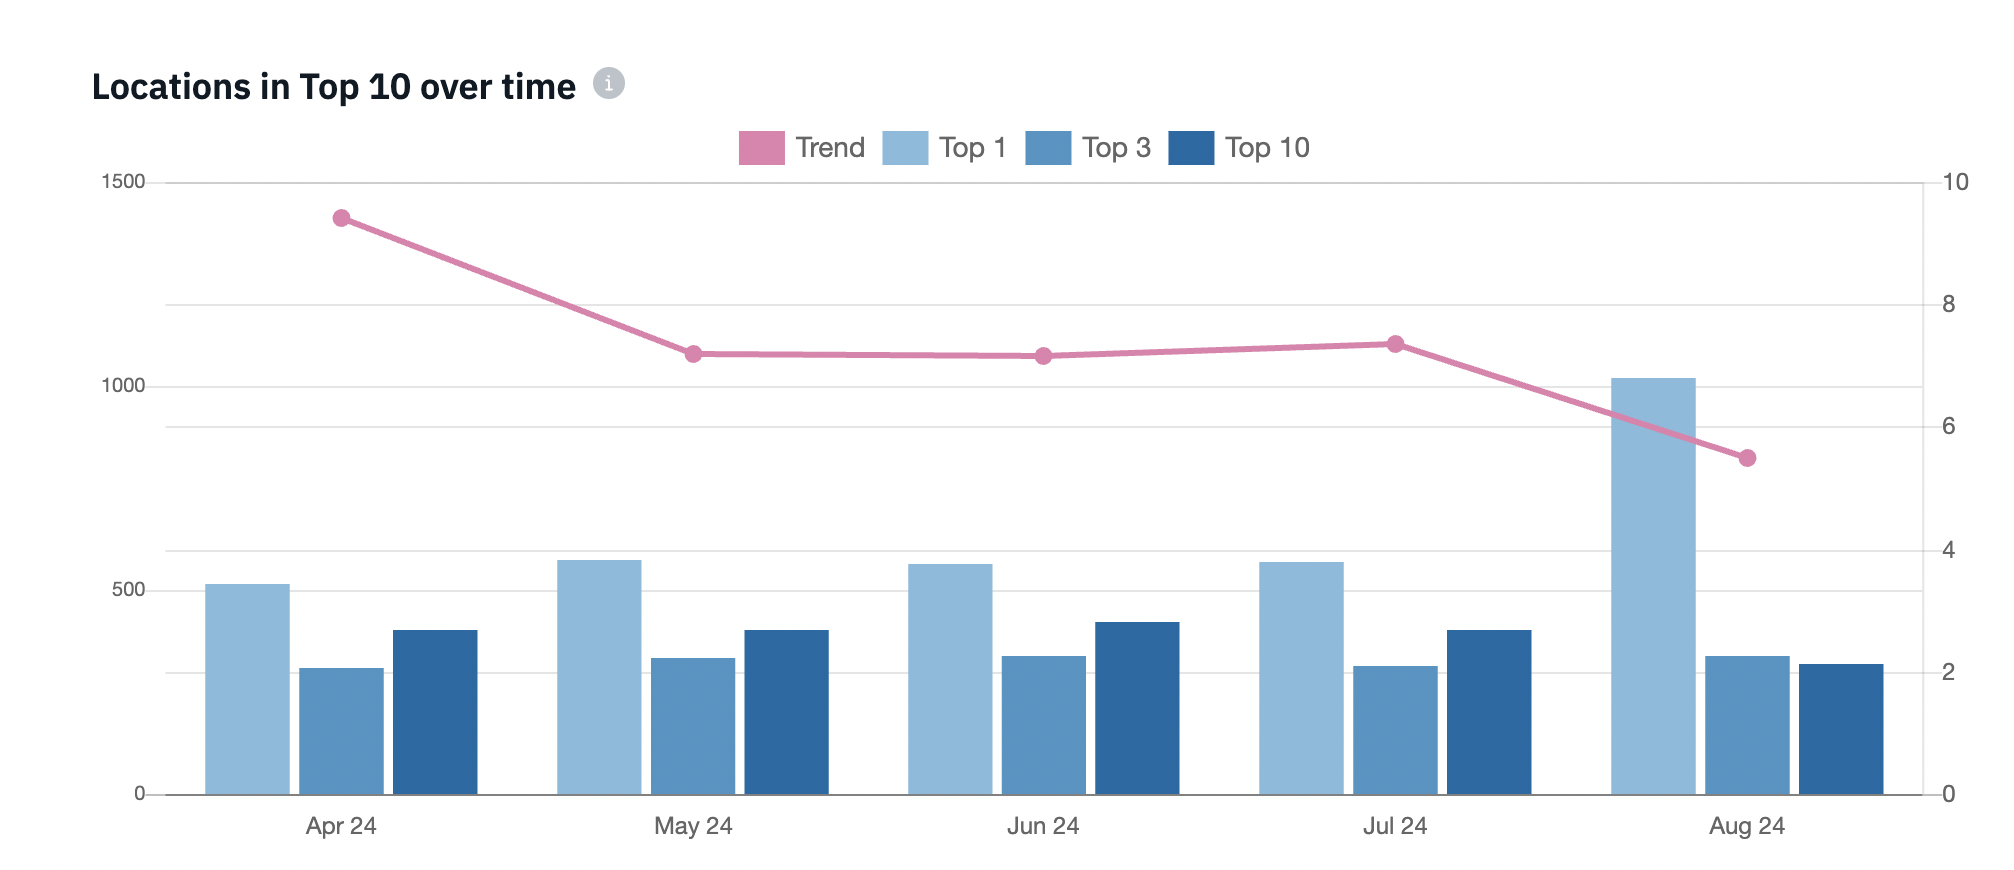
This graph shows the performance of different locations in search rankings over time, focusing on how many locations are ranked within the top 1, top 3, and top 10 positions on search engines. Additionally, it includes a trendline that represents the overall average search position for all selected locations and keywords over the given months.
Key Elements
Bars:
- Light Blue Bars ("Top 1"): These bars show the number of locations that rank first (Top 1) in search results for the selected keywords.
- Medium Blue Bars ("Top 3"): These bars show the number of locations that rank within the top 3 positions.
- Dark Blue Bars ("Top 10"): These bars show the number of locations that rank within the top 10 positions.
Trendline (Pink Line):
This line represents the average search position across all the locations and keywords over time. The lower the trendline, the better the overall average position, as it indicates locations are ranking higher in search results.
Axes:
- X-Axis (Time): The graph is divided by months, showing the data from April to August.
- Y-Axis (Left Side - Number of Locations): This axis shows the number of locations that fall within the top 1, top 3, and top 10 positions.
- Y-Axis (Right Side - Average Search Position): This axis corresponds to the trendline, indicating the average search position across all locations.
Interpretation:
April to May: In April, a high number of locations ranked within the top 1, 3, and 10 positions, with the trendline indicating a better overall average position. However, from May to June, there’s a slight drop in the number of top-ranked locations, though the trendline stabilizes, showing that the overall average search position didn't decline drastically.
June to July: The number of locations in the top positions slightly improves, as seen by the increased bars, and the trendline remains relatively stable.
August: There's a noticeable spike in the number of locations ranking first (Top 1) in August. However, the trendline continues to decline, indicating that while some locations may be doing very well, the overall average position is worsening, suggesting a potential drop in rankings for a broader set of locations.
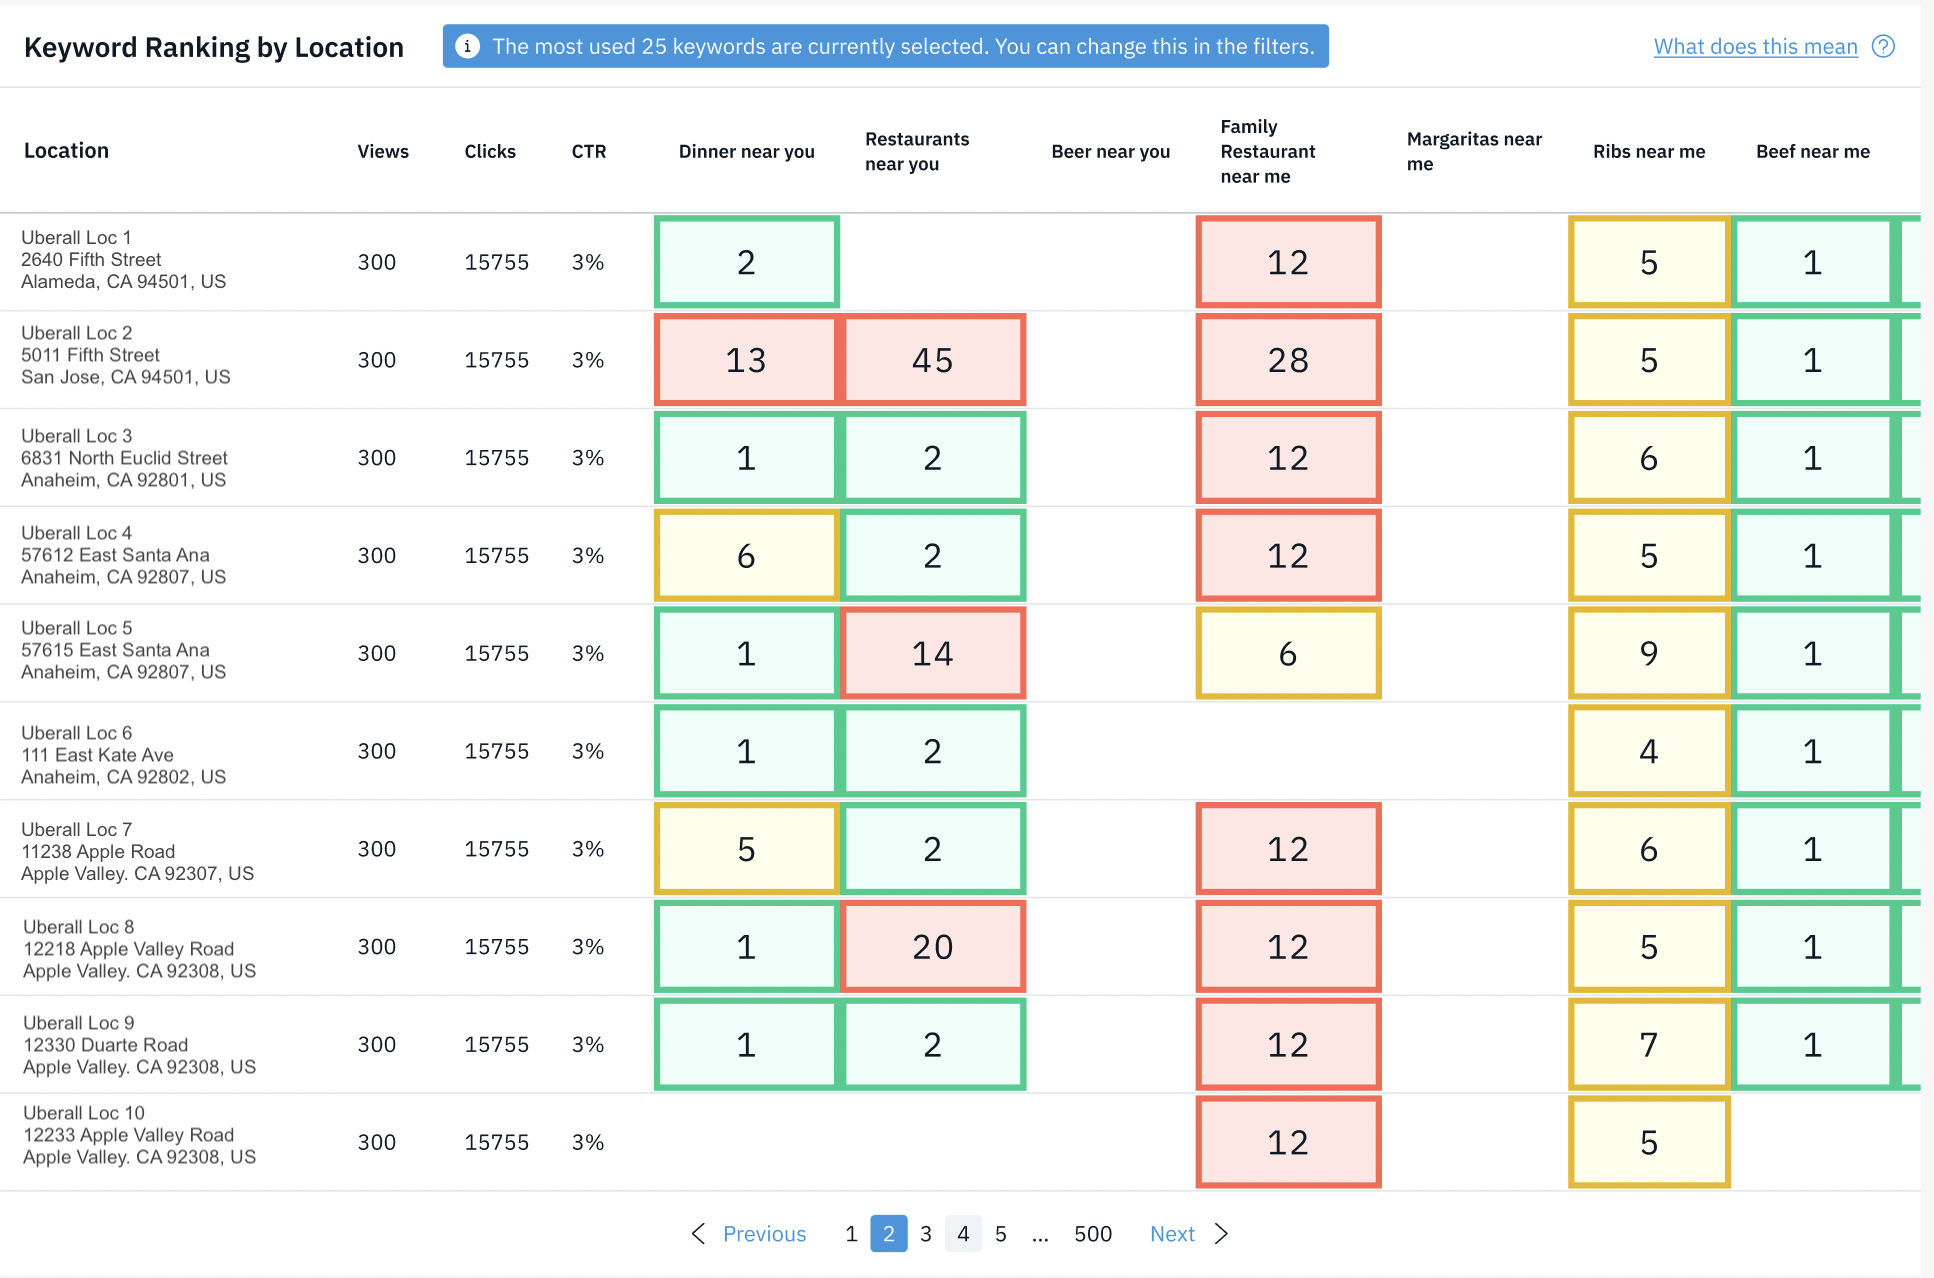
Keyword Ranking Table
This table provides Views, Clicks, CTR, and Average Search Position for each location against each keyword applied to a business for a specific date range.
Understanding Keyword Ranking

Table Definitions
| Location | Location name, location address, city, post code, and country. |
| Views | Number of users who saw the business associated with the location on Google Search and Google Maps. |
| Clicks | Number of users who clicked on the website, directions or phone call link associated with the location on Google Search and Google Maps. |
| CTR | Click-through rate is the number of clicks that your ad receives divided by the number of times your ad is shown: clicks ÷ impressions = CTR. For example, if you had 5 clicks and 100 impressions, then your CTR would be 5%. |
| Ranking Data | See image above. |
Table Supports Up to 25 Keywords
Each location within a business can be optimized for up to 20 keywords, allowing you to track how well that location ranks in search results for those specific terms.
However, the Keyword Ranking by Location table can only display search rank data for up to 25 keywords at a time. This means that if you assign a wide variety of keywords across multiple locations, resulting in more than 25 keywords in total, you will need to select a subset of up to 25 keywords at a time to view their specific rankings.
To ensure you're getting a clear view of your search performance, it's best to carefully choose the most relevant keywords to monitor for each location, rather than applying too many varied keywords across locations.
Supported Countries and Search Engines
Local SEO only supports Google Engine (Google Maps results) at the time being, and is restricted to Locations in the following countries

Enablement
The following must be met to ensure proper enablement for Local SEO Report - please ensure all are met prior to accessing the report:
- Locations must be added to the account prior to enabling the report.
- The account must have at least 1 active location and listing.
- Each location must have at least 1 keyword applied in the keyword section.
- Location must fall within the supported countries. Please reference Supported Countries and Search Engines.
- Report enablement timeframe. Please reference Enablement Timeframe and Data for more details.
Note: Local SEO report cannot be backfilled as the data is collected from the date of its implementation.
Enablement Timeframe and Data
The Local SEO Report displays the data by month. We display data received on the second day of each month for the previous month. Depending on the activation date, it could be the current month or the previous month that a new customer will see data.
For example, enablement date is on Feb 1 or within the first week of the month, if all requirements are met, you should see data appearing within the second week of Feb.
If enablement occurred after the first week of the new month, if all requirements are met, you should see data appearing beginning March.
Note: if you do not see any data loaded on the graph, please select the 3-month data option on the filter to see the results on the graph. If you still don't see any data and the above requirements are met, please reach out to support for additional assistance.
FAQ
Is data displayed by day or month?
The Local SEO Report displays the data by month. We display data received on the second day of each month. Only the previous month’s data is available and displayed for those customers (currently it’s October data). Going forward, depending on the activation date, it could be the current month or the previous month that a new customer will see.
Which search engines and countries are supported?
Reference Supported Countries and Search Engines section listed above.
I have selected keywords for each location however, I don't see any data populated in the report, why is that?
Please reference the enablement section, there it will outline the requirements for proper enablement allowing you to troubleshoot. If the report is enabled correctly, that indicates the keyword or location did not rank.
I have a mix of location, some fall in the supported countries categories and others are outside, so I still need to enable keywords for locations outside of the supported countries?
Adding business-related keywords to your location can be utilized in other areas/modules of the Uberall platform.
My locations or keywords are not performing as desired or intended, what do I need to consider?
If you are not getting data for a subset of keywords, most likely the keyword is performing poorly, and/or the above listing issue could be happening. Firstly, rule out issues with your listing(s). If certain SEO keywords are not performing well for your business or your locations are not ranking for them in the top ten search results, there are several steps you can take to improve their performance - below are some recommendations:
- Keyword Optimization:
- Conduct thorough keyword research to identify relevant keywords.
- Optimize on-page elements and content for targeted keywords.
- Focus on long-tail keywords with lower competition.
- Content Creation:
- Develop high-quality, relevant content incorporating targeted keywords.
- Update and refresh existing content regularly.
- Local SEO Tactics:
- Optimize Google Business Profile listing and use location-specific keywords.
- Encourage customer reviews and ratings for local search visibility.
- Backlink Building:
- Focus on acquiring quality backlinks from reputable sources.
- Explore guest blogging and local community involvement for backlink opportunities.
- Monitoring and Adjustment:
- Monitor keyword performance using analytics tools.
- Adjust strategy based on performance data.
- Consider Paid Advertising:
- Supplement organic efforts with paid advertising campaigns if needed.
Reviews and social media postings significantly impact SEO efforts.
- Reviews and Local SEO:
- Positive reviews enhance credibility and visibility in local searches.
- Quantity, quality, and recency of reviews influence local search rankings.
- Higher review volume can lead to appearing in prominent local search features.
- Responding to all reviews - positive or negative.
- Social Media Posting and Engagement:
- Active social engagement boosts brand awareness and website traffic.
- Sharing content on social media expands content reach and potential backlinks.
- Social media profiles rank in search results, increasing brand visibility.
In essence, positive reviews improve local SEO by boosting credibility, while social media activity indirectly supports SEO by enhancing brand visibility and driving traffic. Integrating review management and social media into SEO strategies maximizes their impact.
Implementing these strategies and continuously refining them can enhance keyword performance and overall search engine visibility. SEO is ever evolving. Be on the lookout for Uberall case studies, newsletters, webinars for more up to date recommendations and changes. Reach out to your Account Manager or Customer Success Manager for any questions.
What is the maximum number of keywords per location?
Each location supports up to 20 keywords. Once the limit is reached, keywords can be swapped, but no additional keywords can be added.
Are there primary vs. secondary keywords?
No. All keywords assigned to a location are treated equally.
How does the product handle geo intent (e.g., “sandwich” vs. “sandwich near me”)?
Each variation is treated as a separate keyword. To track different intents, each keyword must be explicitly added.
How often are rankings crawled?
Rankings are updated monthly, on the same cadence for all customers and environments.
Is historical data backfilled when a keyword is added?
No. Local SEO data is strictly forward-looking from the point the keyword is first tracked.
What does “ranking” mean in Local SEO?
“Ranking” in Local SEO is a business’s relative position in Google’s local search results for a specific query, at a specific location, and at a specific time, as determined by Google’s local ranking algorithms.
Which Google surfaces are measured?
Rankings are based on Google Search (SERP).
The report also shows visibility for Top 1, Top 3 (Local Pack), and Top 10, but all metrics originate from SERP positions.
What do “Top 1 / Top 3 / Top 10” represent?
They represent SERP position thresholds, not blended or weighted metrics.
How is the searcher’s location determined?
Searches are executed from the business’s location, meaning rankings reflect results as if searched from at or near that location. This applies globally, including Japan.
What does the trend line represent?
The trend line shows the average ranking across the selected keywords and locations.
It is not weighted by impressions, clicks, or traffic.
Why might a trend show as 0 or appear missing?
Common reasons include:
The report did not run for that period
The location or keyword did not exist at that time
The keyword was not assigned when the report ran
A report execution error occurred
How are multi-location summary percentages calculated (e.g., “31% Top 1”)?
For a given period and keyword:
(Number of locations ranking in Top 1 ÷ Total number of locations)
What do the rank buckets mean?
What do the rank buckets mean?
Green: Ranked in Top 3
Yellow: Ranked in Top 10
Red: Ranked in Top 50
Grey: Ranked 51 or higher
Blank: Not applicable or no rank recorded
This information is also available via tooltips in the product.
Are rank bucket thresholds configurable?
No. Buckets are hard-coded, and there are currently no plans to make them configurable.
What does “blank / not applicable” mean exactly?
This can occur when:
The keyword ranked below position 51
The keyword was not assigned when the report ran
A report error occurred for that keyword or period
What should customers not expect?
Immediate results after adding keywords
Daily or real-time ranking updates
Historical rankings for newly added keywords
Local SEO reporting is monthly, and keywords must be configured before the report runs to be included.
How does Local SEO relate to Generative Engine Optimization (GEO)?
They are complementary. Strong Local SEO fundamentals are a prerequisite for effective GEO, though GEO may require additional optimization beyond traditional SEO.